


Search the site

You Can Keep the Audience and Still Lose the Click
.jpg)
A client asked me a version of this question three times last month, in three different meetings, phrased three different ways. Is Google dead? Should we stop caring about SEO? Is everyone just using ChatGPT now? I understand the anxiety behind it. Referral traffic is down, a board member forwarded a scary LinkedIn post, and somebody's cousin swears they Googled nothing all week.
Here is the uncomfortable answer. Almost nobody left Google. And your traffic can still be in real trouble anyway. Both of those things are true at the same time, and the gap between them is where most marketing budgets are currently getting misallocated.
I spent part of this year comparing notes with people who actually sit inside this data, analytics leads at publishers, a couple of people who work adjacent to search product teams, researchers who ran the studies everyone is quoting badly. One of them, someone I know who reviews analytics dashboards for a living at a mid-size media company, put it to me bluntly over coffee: "Our audience number looks fine. Our finance team is not fine." That sentence is the entire article, honestly. I am going to spend two thousand words unpacking why both halves of it are simultaneously accurate.
The Number Everyone Keeps Waving Around
The stat making the rounds in every client deck this year is that 95% of ChatGPT users also use Google. It shows up in pitch meetings as proof that AI panic is overblown. It is real. It comes from Similarweb, and it has barely moved. In September 2025 the overlap sat at 95%. By May 2026, after visits to generative AI platforms had grown roughly 70% year over year, it was still sitting at 95%, according to Similarweb's own tracking panel.
Search overall still pulls something like 3.3 billion average monthly unique visitors worldwide, while every generative AI chatbot combined sits at a fraction of that. Even after a year of explosive growth, the entire AI chatbot category is still roughly a fifth the size of search. The AI layer is being built on top of the search layer, not instead of it.
Here is where I think most marketers get sloppy, and I include past versions of myself in that group. Overlap is a very low bar. Similarweb counts you as a Google user if you run one search in a month. One. That means somebody who has quietly moved most of their research, their comparisons, their first drafts of an idea, over to a chatbot, and only opens Google to check store hours or log into their bank, gets filed under the exact same label as somebody who still runs forty searches a day. The overlap number cannot see that difference, and it was never designed to.
It also does not touch API traffic, desktop apps, or the AI features baked directly into other products, which is precisely the usage that behaves most like substitution rather than addition. So when a client tells me "our AI overlap looks fine," my honest answer is that overlap was never the metric that was going to catch the thing they should actually be worried about.

A quieter data point that agencies undersell
Pew Research surveyed over five thousand US adults in February 2026 and found that 42% now use a chatbot specifically to find information, and 60% say they read AI-generated summaries sitting at the top of their search results. Nearly half of American adults have used a chatbot at all. "Ever used" is a generous bar, roughly as generous as "used Google once this month." It tells you adoption is real. It tells you nothing about how your specific traffic is behaving.
Using Google Is a Low Bar. Losing Queries Is a Real Cost.
So if overlap does not settle the argument, what does? A working paper out of Bocconi University gets us closer, and it is the study I keep sending to clients who ask for something with an actual control group attached.
Researchers there used Comscore's US desktop clickstream data running from October 2024 through July 2025, a window that covers three separate expansions of ChatGPT Search access. They compared households that gained access against similar households that had none. On average, households that gained access ran 3.14 fewer traditional search queries per week, a 9.4% drop from a pre-expansion average of roughly 33.5 queries. That gap did not stay at 9.4%. It kept widening the longer households had access, reaching 17.0% by the twenty-week mark.
Sources: Bocconi University working paper (Comscore desktop panel, Oct 2024 to Jul 2025); Similarweb, 2026.
Read those two rows together and you get the whole story of 2026 in one line. Google's audience held. The queries did not. Overlap and query volume are simply not measuring the same behavior, and yet they get quoted interchangeably in almost every client conversation I sit in on.
The Bocconi researchers are careful to call these patterns descriptive, not causal proof, and I want to be equally careful here. But the direction across every dataset I looked at this year points the same way, and when three independent research teams using three different methods all lean the same direction, I stop treating it as a coincidence and start treating it as a trend I need to plan around.
The category breakdown inside that same paper is where it gets specific enough to act on. Referrals to academic sites dropped 32.8%. Reference sites dropped 26.5%. Developer sites dropped 15.1%. News sites dropped 13.4%. Marketplaces and entertainment sites barely moved, statistically indistinguishable from zero in some cases.
| Site category | Change in search referrals | What that tells you |
|---|---|---|
| Academic sites | -32.8% | Pure lookup tasks get absorbed almost entirely |
| Reference sites | -26.5% | Definitions, explainers, "what is" content is exposed |
| Developer sites | -15.1% | Documentation and how-to content is at real risk |
| News sites | -13.4% | Timely, informational coverage takes a real hit |
| Marketplaces | ~0%, not distinguishable from zero | Transactional intent still routes to search |
| Entertainment sites | ~0%, not distinguishable from zero | Browsing and discovery intent is largely untouched |
Source: Bocconi University working paper, descriptive findings, not yet peer-reviewed. Swipe sideways on mobile to see every column.
That is not a random distribution. It is almost a perfect map of which content types answer a question completely inside a chat window, versus which ones require you to actually go somewhere, buy something, or watch something. If your site lives in the top four rows of that table, this is not a someday problem.
Our impressions are flat, our rankings are flat, and our organic sessions are down eighteen percent year over year. I spent two board meetings trying to explain that those three sentences are all true at once. A search practitioner I spoke with, who leads analytics at a regional news publisher
What Happens When Google Becomes the Chatbot
Here is the part of the research that finally made this click for me, no pun intended. A separate, preregistered field experiment recruited 1,100 US Chrome users who already treat Google as their main search engine. Researchers watched their normal behavior for three days, then split them into three groups for a week: standard Google, Google with AI Overviews hidden, and Google with every search routed through AI Mode.
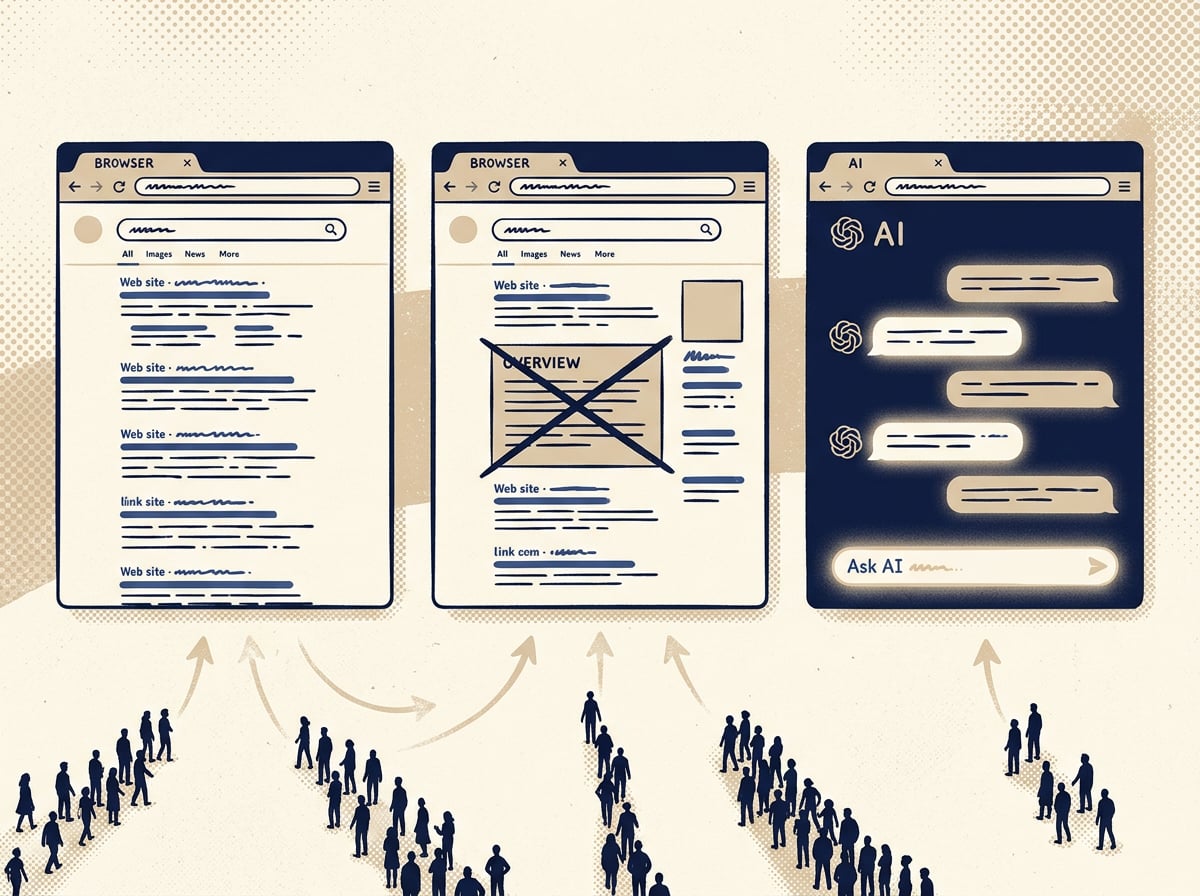
At baseline, only 0.6% of this group's searches used AI Mode voluntarily. Once assigned, 94.7% of the treatment group's searches got routed there. That is forced, full adoption, not the slow opt-in most people actually experience, and the researchers are upfront that voluntary use might look different. Even with that caveat, the numbers are hard to wave away.
Three metrics, three different trend lines. A dashboard that only tracks the first box is telling you the least useful third of the story.
Under full AI Mode assignment, click-through to external sites fell by 18.8 percentage points, with a 95% confidence interval running from -22.2 to -15.3. That is not noise. Search sessions dropped by roughly 0.92 per day from an average baseline of 4.0. More frequent Google users saw the largest declines, which is a detail I think agencies serving high-intent categories should sit with for a second. Meanwhile, average session duration actually went up by 0.43 minutes. People were not searching less because they lost interest. They were getting fuller answers inside one window and never leaving it.
| Metric under full AI Mode assignment | Change vs. standard Google |
|---|---|
| Click-through to external sites | -18.8 percentage points |
| Search sessions per day | -0.92, from a baseline of 4.0 |
| Clicks to news sites | -12.5 percentage points |
| Clicks to Reddit | -21.2 percentage points |
| Clicks to Wikipedia | -9.9 percentage points |
| Average session duration | +0.43 minutes |
| Use of Bing, DuckDuckGo, or Yahoo | +11.2 percentage points |
Source: preregistered field experiment, arXiv preprint, August 2026. Swipe sideways on mobile to see every column.
People also went looking for alternatives. Use of Bing, DuckDuckGo, or Yahoo climbed by 11.2 points among the AI Mode group, even as their trust, satisfaction, and sense of usefulness all fell. About 15% of respondents who answered an open-ended survey question said they had trouble reaching specific websites at all. One participant, quoted in the paper, described the experience as the assistant telling them about a website instead of taking them there.
An earlier, smaller experiment by a different research team found the same directional result and labeled it exploratory because of dropout concerns. This newer study was preregistered specifically to rule that out, and it found no evidence of increased dropout. When two separate experiments, run by different teams, on different populations, land on the same conclusion, that is no longer a fluke you can dismiss in a board meeting.
The Counter-Evidence Nobody Quotes Loudly Enough
I want to be fair to the other side of this, because the research is genuinely mixed and treating it as settled would be dishonest. A separate working paper tracked nearly 4,400 Comscore desktop users who adopted a large language model between August 2023 and January 2024, well before ChatGPT Search or AI Mode existed. That study found adoption was linked to more unique website visits overall, plus a temporary bump in traditional search activity that faded over time. A companion field study with just over 300 Chrome users found sessions that mixed a chatbot and a search engine ran longer and touched more sites than chatbot-only sessions, which were shorter and narrower.
So which is it? Both, depending on the product generation and the task. The earlier studies predate ChatGPT Search and AI Mode, meaning they describe an earlier, less capable product than the one people are using today. Someone I spoke with who has reviewed this whole body of research for a search-adjacent product team put it this way: early chatbot use looked like curiosity added on top of an existing habit. What is showing up now, in the newer studies, looks more like substitution for a specific, narrower slice of tasks. Both descriptions can be true of the same market at different points in its adoption curve.
Why This Actually Matters for Your Traffic Report

Google itself is not shy about its own numbers. At its 2026 developer keynote, Sundar Pichai said AI Overviews had crossed 2.5 billion monthly active users, with AI Mode passing 1 billion in its first year. His framing, in his own words, was that "when people use our AI-powered features in Search, they use Search more." I do not doubt the internal number. I just do not think it answers the question most site owners are actually asking, which is not "does Google's overall usage look healthy" but "does my specific content still get chosen, and does that choice still send me a visitor."
Those are different questions with different answers, and 2026 is the year that gap became impossible to paper over with a single audience metric.
Treating "our Google audience is stable" as good news
Stable audience with falling queries and falling clicks is not stability. It is the same headcount doing less of the thing that used to reach you. Track sessions and referral clicks separately from any overlap or reach number, because they can move in opposite directions for months.
Assuming every content type is equally exposed
The category data says otherwise. Reference and academic content is getting absorbed fastest. Transactional and entertainment content is holding up. Know which bucket your core content sits in before you panic, or before you decide not to.
Blaming a ranking drop when it is actually a click drop
A page can hold its position and still lose the visitor, especially once a model can answer the query fully on the results page itself. Check impressions against clicks before you rewrite anything. The problem might not be visibility at all.
Ignoring branded search lift as a real, if invisible, conversion path
Someone asks a chatbot for a recommendation, then searches your brand name on Google. That shows up in your analytics as an organic visit with no trail back to the chat that started it. Most teams are not built to attribute it, which does not mean it is not happening.
This is the same trust problem I keep coming back to in client work. When a chatbot can answer a question completely, the content that still gets chosen and clicked is the content a model cannot fake or fully absorb, which is exactly what I dug into in You Can Still Game AI Visibility. You Just Cannot Keep the Winnings.
What I'd Actually Tell a Client to Do This Quarter
| Action | Why it matters right now |
|---|---|
| Split your dashboard into audience, sessions, and clicks | Each one is currently telling a different story, and averaging them together hides the one that is actually declining |
| Audit content by task type, not just by keyword | Reference and how-to content is absorbed fastest. Comparison, transactional, and experience-based content still sends real visitors |
| Track branded search as its own line item | It is the closest thing you have to a proxy for AI-driven demand that your analytics can actually see |
| Publish something a model has to cite, not summarize | Original data, named outcomes, and primary research survive being absorbed. Generic explainers do not |
| Stop reporting overlap or reach as a health metric on its own | It answers "did people leave," which was never really the danger. It says nothing about whether they still click |
Swipe sideways on mobile to see every column.
If you want the longer case for why "publish something citable" is quickly becoming the whole game, that is the exact argument I make in GEO Is Not a Trend. It's the New Default for Anyone Who Wants to Be Found Online.
None of These Datasets Can See the Whole Board
I want to end on the honest limitation, because every one of these studies has one. Nothing here tracks the same individual across Google, AI Mode, ChatGPT, and Gemini over months at the level of an individual task. Similarweb measures audiences, not sessions. The Bocconi and earlier Comscore-based research covers desktop behavior only, and the Bocconi window ends in July 2025, before AI Mode reached its current scale. The field experiment ran for exactly one week with about a thousand people who skew younger, more educated, and more left-leaning than the country as a whole. Every one of these papers is still a preprint or working paper, none of them peer-reviewed yet.
So hold the conclusions with the right amount of confidence. Directionally consistent across three independent methods is meaningful. It is not the same as settled science, and I will keep updating this if the peer review process changes any of it.
Alphabet's next earnings call, usually late October, is where I expect Google to update its query-growth claim again. The thing worth listening for is not whether the number goes up. It almost always does. It is whether they finally attach a baseline to it, because right now the industry is being asked to trust a trend line with no starting point.
Here is the version of this I actually believe, after reading all of it twice and arguing about it with three different people who live inside this data for a living. Google is not losing its audience. It is losing the click, one careful, well-answered query at a time, and only in the categories where a chat window can finish the job without you. If you know which of your pages sit in that danger zone, you can still win this decade. If you do not, the traffic report is going to keep confusing you every single quarter, no matter how healthy your overlap number looks.
If you want a second set of eyes on which of your content is exposed and which is holding, that is a conversation we have with clients every week, no deck required.
Related ...





Subscribe to our insights


